We use geographic information system (GIS) mapping tools to identify and prioritize building sites. GIS map displays help us analyze data from multiple sources, including:
- USDA list of 500+ rural counties with persistent child poverty
- USDA Food Atlas, identifying areas of low food access (deserts) or areas dominated by lower quality food sources such as dollar stores and convenience stores (swamps)
- Feeding America affiliate food bank locations (targeting sites at least 2 hours from a regional food bank)
- US Census Bureau’s American Community Survey, focusing on measures of poverty, the elderly, and children
- US Census city populations (targeting cities of 5,000 or less to maximize USDA grant potential)
- Roadway characteristics, to confirm the location can be accessed by 18-wheelr tractor-trailers
- Tribal nation boundaries
- Opportunity Zones or other areas subject to incentive grants or loans
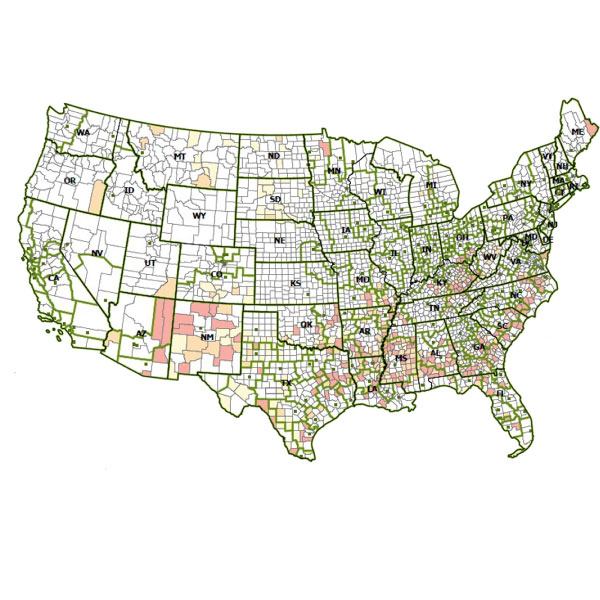
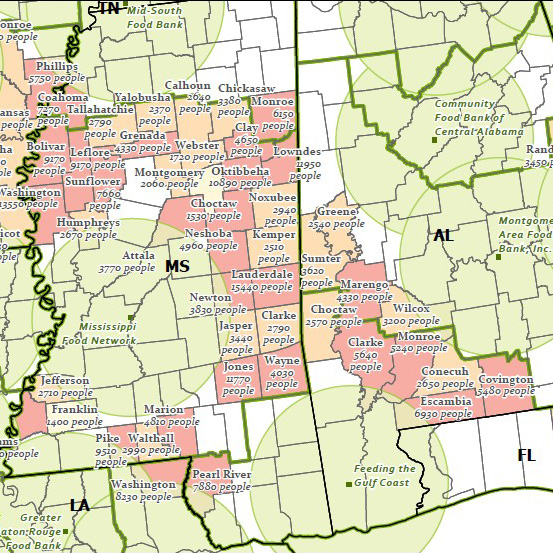
The maps below illustrate how we are surveying counties nationwide for candidate sites. The national map identifies counties that are a targeted distance (e.g., two hour drive or greater) from the regional food bank that serves them. For those distant counties, we then highlight the counties where USDA reports persistent child poverty. For those counties, the tool then displays how many people are food insecure (per USDA and Feeding America reports), shown by shading and labels with population counts. Additional layers are then used to identify specific communities where our warehouses can serve as local hubs for both food producers and hunger relief programs.